Fig. 4
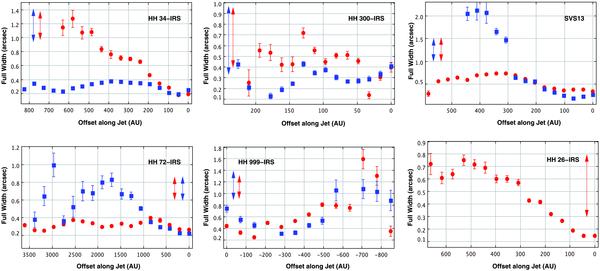
Widths of the H2 2.122 μm and [Fe ii] 1.644 μm jet components plotted against distance from each source, corrected for flow inclination angle and seeing. Filled red circles indicate H2 data; blue squares show [Fe ii] data. The arrows show the effective angular resolution (FWHM) measured from Gaussian fits to continuum data in the H and K-bands. Zero offset in each x-axis corresponds to the source continuum position; positive offsets increase to the left in each panel in Figs. 1 and 2. Note that only the brighter, north-easterly flow lobe is plotted for HH 300-IRS.
Current usage metrics show cumulative count of Article Views (full-text article views including HTML views, PDF and ePub downloads, according to the available data) and Abstracts Views on Vision4Press platform.
Data correspond to usage on the plateform after 2015. The current usage metrics is available 48-96 hours after online publication and is updated daily on week days.
Initial download of the metrics may take a while.