Fig. 3
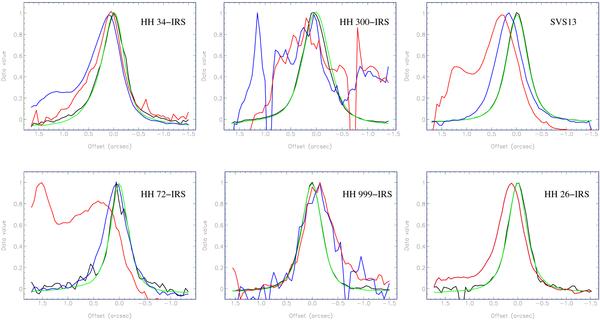
Profiles of Brγ 2.166 μm (black), H2 2.122 μm (red) and [Fe ii] 1.644 μm (blue) line emission plotted along the jet axis for each source (the offset axis is measured in the plane of the sky). The profile of the continuum emission adjacent to Brγ is also plotted for reference (in green); this marks the nominal location of the embedded source, and gives an upper limit to the resolution along the flow axis. The profiles have been normalised to the peak flux. Offsets increase to the left in Figs. 1 and 2.
Current usage metrics show cumulative count of Article Views (full-text article views including HTML views, PDF and ePub downloads, according to the available data) and Abstracts Views on Vision4Press platform.
Data correspond to usage on the plateform after 2015. The current usage metrics is available 48-96 hours after online publication and is updated daily on week days.
Initial download of the metrics may take a while.