Fig. 2
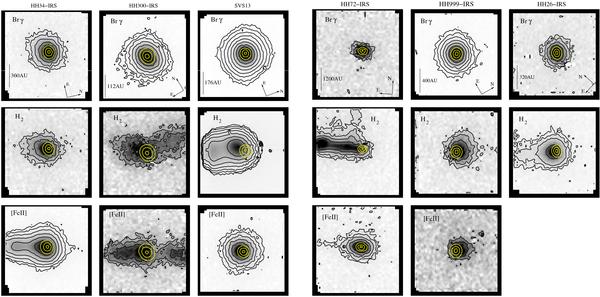
Image plus contour plots showing (continuum-subtracted) Brγ 2.166 μm, H2 2.122 μm and [Fe ii] 1.644 μm emission towards HH 34-IRS, HH 300-IRS, SVS 13, HH 72-IRS and HH 999-IRS. Only Brγ 2.166 μm and H2 2.122 μm images are shown for HH 26-IRS. For reference, contours showing the position of the continuum adjacent to each emission line are over-plotted in yellow. Black contours start at 3σ and increase in multiples of 2. The yellow continuum contours mark 50%, 75% and 95% of the peak flux in each continuum image. All figures are plotted to the same scale; the scale bar corresponds to 0.8″ in all data. The horizontal axis in each panel is aligned with the nominal flow direction.
Current usage metrics show cumulative count of Article Views (full-text article views including HTML views, PDF and ePub downloads, according to the available data) and Abstracts Views on Vision4Press platform.
Data correspond to usage on the plateform after 2015. The current usage metrics is available 48-96 hours after online publication and is updated daily on week days.
Initial download of the metrics may take a while.