Fig. C.1
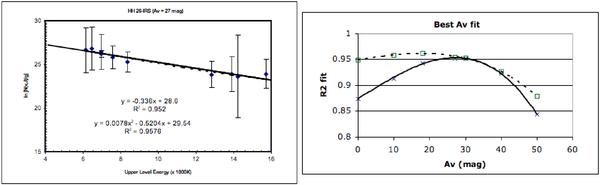
The left-hand panel shows an H2 excitation diagram for HH 26-IRS. The data, corrected for extinction (Av = 27 in this case), have been fitted with a straight line and a second-order polynomial (dashed line). The equations describing each fit are displayed; the R2 values represent the square of the correlation coefficient associated with each fit. Plots over a range of Av values were generated and R2 measured for the two fits in each case. The right-hand panel shows a plot of R2 against Av. Data from the linear and polynomial fits are represented by a cross and an open square, respectively; the full and dashed lines represent third-order polynomial fits to these data. The peak in each curve in the right-hand plot marks the extinction associated with the greatest value of R2, which in turn is associated with the least scatter about the linear and polynomial fits in the excitation diagram.
Current usage metrics show cumulative count of Article Views (full-text article views including HTML views, PDF and ePub downloads, according to the available data) and Abstracts Views on Vision4Press platform.
Data correspond to usage on the plateform after 2015. The current usage metrics is available 48-96 hours after online publication and is updated daily on week days.
Initial download of the metrics may take a while.