Fig. 13
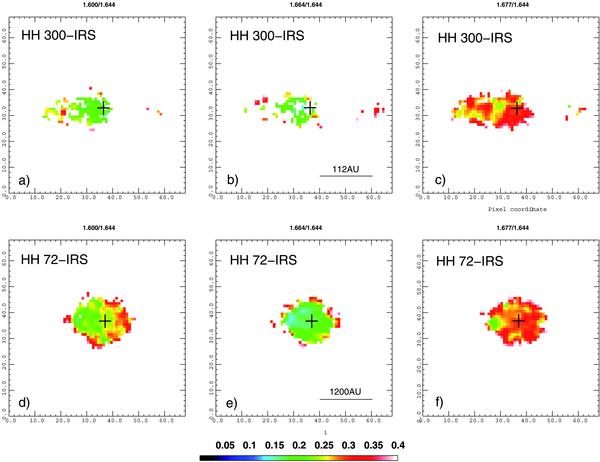
Images showing [Fe ii] line ratios that are sensitive to the electron density, for HH 300-IRS a)–c) and HH 72-IRS d)–f). 1.600 μm/1.644 μm, 1.664 μm/1.644 μm and 1.677 μm/1.644 μm ratios are shown for each source. Regions with no line emission have again been masked. The crosses mark the H-band continuum peak position in each image; the scale bars measure 0.8″.
Current usage metrics show cumulative count of Article Views (full-text article views including HTML views, PDF and ePub downloads, according to the available data) and Abstracts Views on Vision4Press platform.
Data correspond to usage on the plateform after 2015. The current usage metrics is available 48-96 hours after online publication and is updated daily on week days.
Initial download of the metrics may take a while.