Free Access
Fig. 5
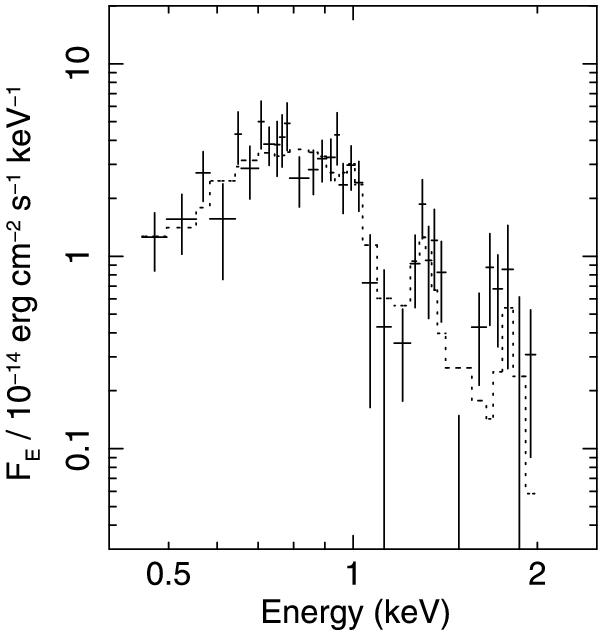
The ACIS-S spectrum of the southern X-ray nebula of Mrk 273. The dotted-line histogram shows the best-fit thermal emission spectrum (see text for details). Note strong emission-lines from Mg xi and Si xiii in the 1–2 keV range.
Current usage metrics show cumulative count of Article Views (full-text article views including HTML views, PDF and ePub downloads, according to the available data) and Abstracts Views on Vision4Press platform.
Data correspond to usage on the plateform after 2015. The current usage metrics is available 48-96 hours after online publication and is updated daily on week days.
Initial download of the metrics may take a while.