Fig. 2
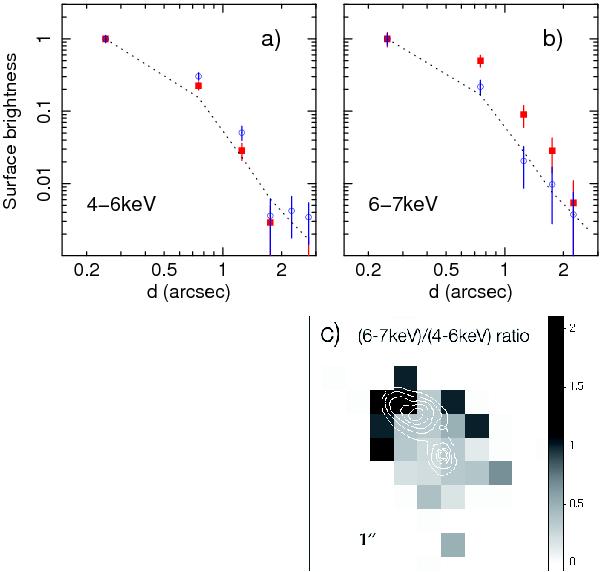
a) The radial surface brightness profiles of the NE (squares) and SW (circles) halves in the 4–6 keV band, with the simulated PSF at 4.51 keV (dotted line); b) same as a) but in the 6–7 keV band, with the similated PSF at 6.4 keV (dotted line); c) The (6–7 keV)/(4–6 keV) ratio image of the nuclear region of Mrk 273, overlaid by the NICMOS H-band image contours showing the N and SW nuclei. The contours are drawn at five logarithmic intervals with the lowest level at 20% intensity of the peak brightness at the centre of the SW nucleus. The orientation of the image is north up, east to the left. The scale bar indicates 1 arcsec. This map shows a trend of a 6–7 keV band enhancement towards NE.
Current usage metrics show cumulative count of Article Views (full-text article views including HTML views, PDF and ePub downloads, according to the available data) and Abstracts Views on Vision4Press platform.
Data correspond to usage on the plateform after 2015. The current usage metrics is available 48-96 hours after online publication and is updated daily on week days.
Initial download of the metrics may take a while.