Fig. 1
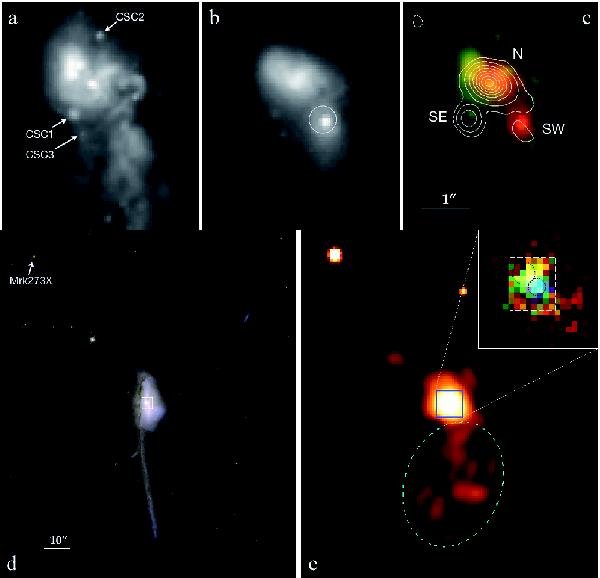
a) The HST-ACS I band (F814W) image of the nuclear region of Mrk 273. Candidate star clusters used to register the NICMOS image with the ACS image are labeled in order of their luminosity. The orientation of this and all the other images is north up, east to the left. b) The HST-NICMOS H-band (F160W) image of the same region as in a). The point-like SW nucleus, which is not evident in the optical band, is clearly visible. The centroid of the hard X-ray (4–6 keV) source is indicated by the error circle of 0.35 arcsec radius. c) The composite of the I-band (green) and H-band (red) images of the same region as in a) and b), overlaid by the VLA 8.4 GHz image (Condon et al. 1991) in contours. No astrometric correction has been applied to the VLA image. The three radio components, N, SE and SW are labeled. The lowest contour represents 8% level of the peak brightness at the N component and other contours increases by factors of 3.3. The scale bar indicates 1 arcsec (= 0.77 kpc). d) The HST-ACS B (F435W) + I (F814W) composite image of a large field of view (2.0′ × 2.3′) around Mrk 273. The area of the images for the nuclear region in a), b) and c) is indicated by a white rectangle. The bright, point-like X-ray source Mrk 273 X, a distant (z = 0.46) Seyfert 2 galaxy, seen in the X-ray image (Fig. 1e) and used to register the Chandra image with the ACS image is labeled. The scale bar indicates 10 arcsec (= 7.7 kpc). e) The Chandra ACIS-S 0.4–7 keV image of the same area of the sky as in d). Details of the bright, central part are shown in the inset: three colour composite of unsmoothed images of the 0.4–1.1 keV (red), 1.1–3 keV (green) and 3–7 keV (blue) bands for the 10′′ × 10′′ region, as marked in the main figure. The two black, dashed circles indicate the regions where the spectral data (N and SW) shown in Fig. 3 were taken. The SW region is centred on the hard X-ray source, where the X-ray colour is the bluest. The white dashed rectangle indicates the region for a), b) and c). The ellipse in the main figure indicates the region where the spectral data for the southern X-ray nebula (Fig. 5) were collected.
Current usage metrics show cumulative count of Article Views (full-text article views including HTML views, PDF and ePub downloads, according to the available data) and Abstracts Views on Vision4Press platform.
Data correspond to usage on the plateform after 2015. The current usage metrics is available 48-96 hours after online publication and is updated daily on week days.
Initial download of the metrics may take a while.