Fig. 5
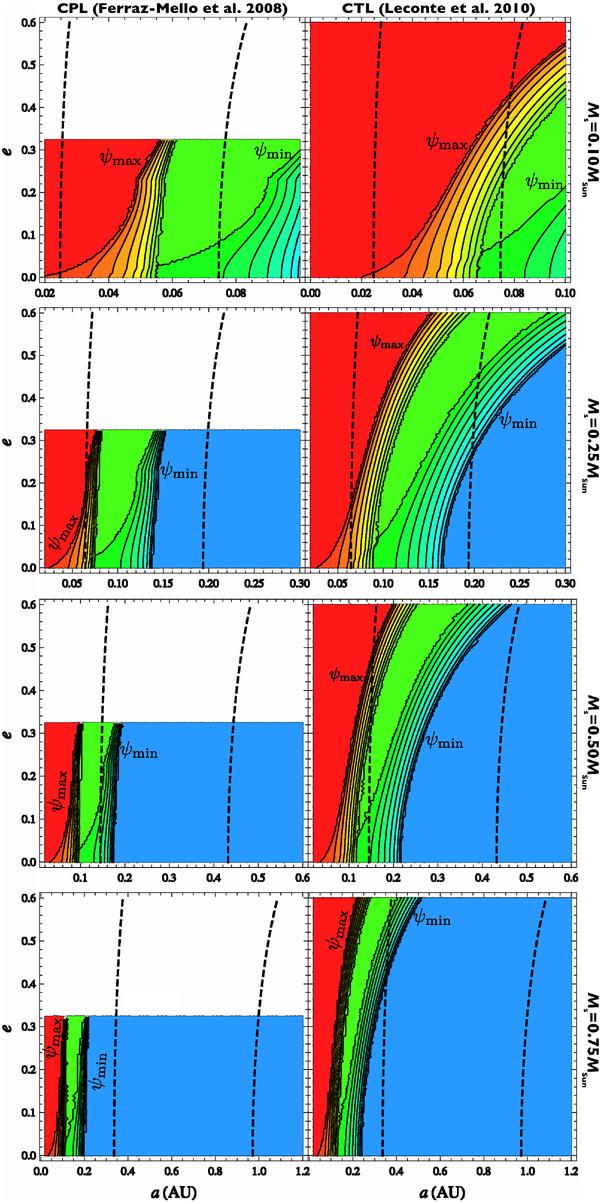
Obliquity thresholds ψmax and
ψmin as explained in the text. For each 9-tuple of
contours the lines indicate 1°,20°,30°,...,70°,80°, and 89°. The
IHZ is indicated with dashed lines. In the red zone,
 for any
obliquity. For e ≳ 0.327 the CPL model breaks down, so this
region is left blank.
for any
obliquity. For e ≳ 0.327 the CPL model breaks down, so this
region is left blank.
Current usage metrics show cumulative count of Article Views (full-text article views including HTML views, PDF and ePub downloads, according to the available data) and Abstracts Views on Vision4Press platform.
Data correspond to usage on the plateform after 2015. The current usage metrics is available 48-96 hours after online publication and is updated daily on week days.
Initial download of the metrics may take a while.