Fig. 8
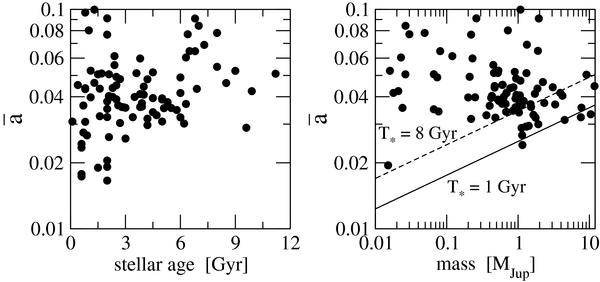
Left: current values of the normalized semimajor axis  for close-in exoplanets as a function of the stellar age T∗. Notice that bodies with
  are limited to young systems (T∗ < 3 Gyr), while larger semimajor axes are found for all stellar ages. Right: original distribution in the
  diagram. Diagonal curves give limits to the orbital decay leading to disruption for two stellar ages: the continuous line show results for T∗ = 1 Gyr, while the dashed line corresponds to T∗ = 8 Gyr.
Current usage metrics show cumulative count of Article Views (full-text article views including HTML views, PDF and ePub downloads, according to the available data) and Abstracts Views on Vision4Press platform.
Data correspond to usage on the plateform after 2015. The current usage metrics is available 48-96 hours after online publication and is updated daily on week days.
Initial download of the metrics may take a while.