Fig. 7
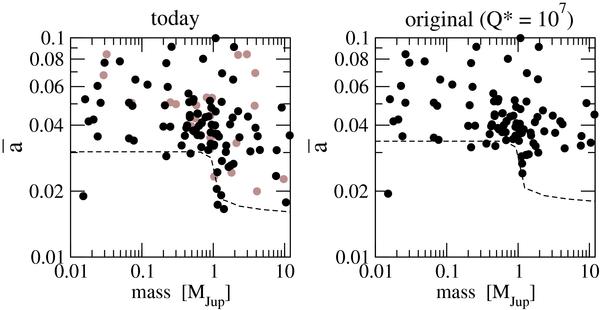
Left: current-day distribution of exoplanets in the  diagram. Black circles show planets for which values of M∗, R∗ and stellar ages T∗ are available. Gray circles show those bodies for which stellar data is missing. Right: reconstructed original distribution assuming backward orbital evolution from stellar tides for the age of each parent star. In both plots, the dashed curves show the lower limit to normalized semimajor axis, as a function of the planetary mass, obtained from the hydrodynamical simulations and scaled along the y-axis to fit the exoplanets.
Current usage metrics show cumulative count of Article Views (full-text article views including HTML views, PDF and ePub downloads, according to the available data) and Abstracts Views on Vision4Press platform.
Data correspond to usage on the plateform after 2015. The current usage metrics is available 48-96 hours after online publication and is updated daily on week days.
Initial download of the metrics may take a while.