Free Access
Fig. 4
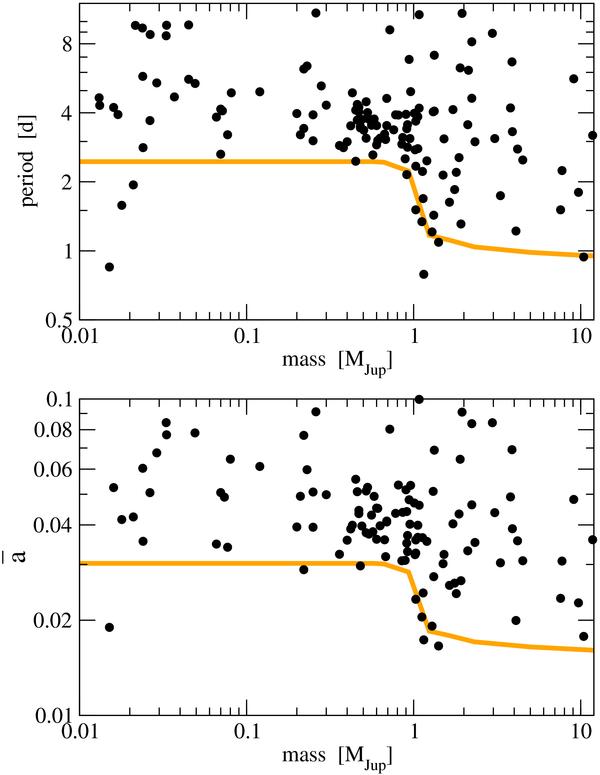
Black circles reproduce the mass-period distribution of known close-in exoplanets. The broad orange band represents the final semimajor obtained from the runs, scaled along the y-axis to fit the observational data. In the lower frame,  denotes the normalized semimajor axis defined in Eq. (5).
Current usage metrics show cumulative count of Article Views (full-text article views including HTML views, PDF and ePub downloads, according to the available data) and Abstracts Views on Vision4Press platform.
Data correspond to usage on the plateform after 2015. The current usage metrics is available 48-96 hours after online publication and is updated daily on week days.
Initial download of the metrics may take a while.