Free Access
Fig. 2
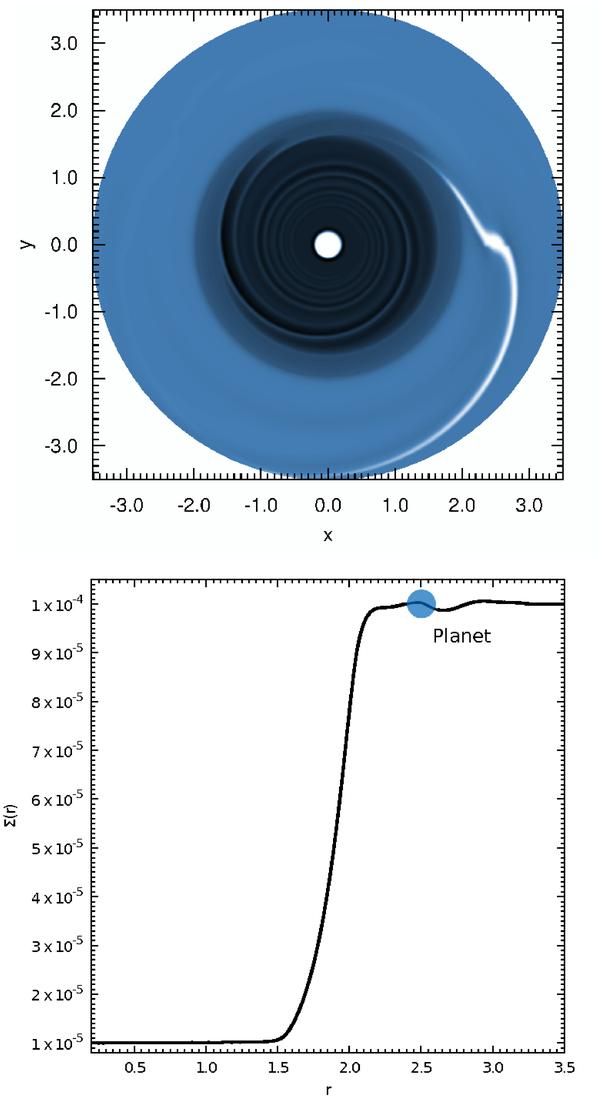
Snapshot of the surface density profile of one of our simulations. The inner cavity is centered around r = 1.8. In the top frame, the low-density regions are shown in black, while the high-density regions are shown in white. The planet (m = 0.1 MJup) is located on the x-axis.
Current usage metrics show cumulative count of Article Views (full-text article views including HTML views, PDF and ePub downloads, according to the available data) and Abstracts Views on Vision4Press platform.
Data correspond to usage on the plateform after 2015. The current usage metrics is available 48-96 hours after online publication and is updated daily on week days.
Initial download of the metrics may take a while.