Fig. 4
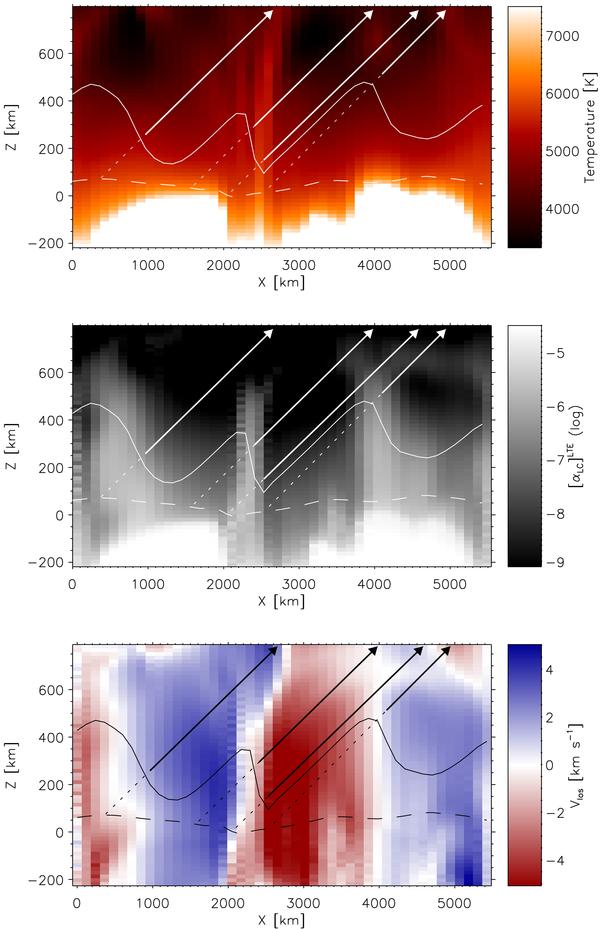
Properties of the model along a slice of one of the snapshots at μ = 0.3: temperature, absorption coefficient at the core of Fe i 6301.5 Å, and line of sight velocity from top to bottom. The solid line that is overplotted over the three panels represents the layer where τLC = 1 along the line of sight. Four rays are shown as solid lines above τLC = 1 and dashed below this height. The bottom panel shows the line-of-sight velocities along the direction shown by the rays. The horizontal dashed line represents the layer where τ500 equals 1 at μ = 0.3.
Current usage metrics show cumulative count of Article Views (full-text article views including HTML views, PDF and ePub downloads, according to the available data) and Abstracts Views on Vision4Press platform.
Data correspond to usage on the plateform after 2015. The current usage metrics is available 48-96 hours after online publication and is updated daily on week days.
Initial download of the metrics may take a while.