Fig. 4
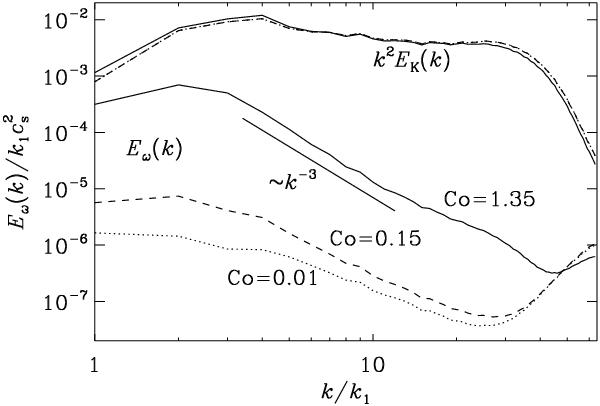
Time-averaged enstrophy spectra, Eω(k), compared with k2EK(k), for Re = 25, Stforce = 0.4, and three values of the Coriolis number. The curves of k2EK(k) are close together and overlap for Co = 0.01 (dotted) and 0.15 (dashed), so it becomes a single dash-dotted line. The k-3 slope is shown for comparison. In all three cases we have kf/k1 = 4.
Current usage metrics show cumulative count of Article Views (full-text article views including HTML views, PDF and ePub downloads, according to the available data) and Abstracts Views on Vision4Press platform.
Data correspond to usage on the plateform after 2015. The current usage metrics is available 48-96 hours after online publication and is updated daily on week days.
Initial download of the metrics may take a while.