Fig. A.3
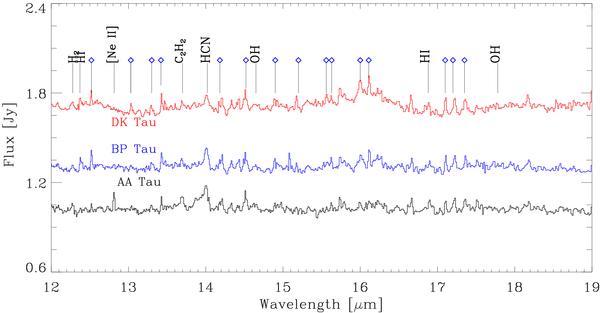
Archival SH spectra of DK Tau and BP Tau showing a variety of emission lines from water and organic molecules. We present for comparison the spectrum of AA Tau previously presented in Carr & Najita (2008). The empty diamonds show the position of some water lines (see Pontoppidan et al. 2010). The spectra were background subtracted and shifted to allow comparison.
Current usage metrics show cumulative count of Article Views (full-text article views including HTML views, PDF and ePub downloads, according to the available data) and Abstracts Views on Vision4Press platform.
Data correspond to usage on the plateform after 2015. The current usage metrics is available 48-96 hours after online publication and is updated daily on week days.
Initial download of the metrics may take a while.