Fig. A.1
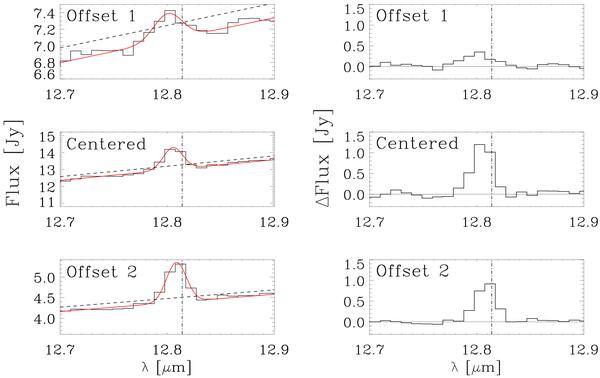
Spectrum of L1551 IRS 5 surrounding the position of the [Ne II] line at 12.8 μm. The plots on the left panel show the average of 2 pointings at each position. We have labeled the positions as Offset 1, Centered, and Offset 2. The spectrum obtained for the position “Centered” has the highest flux in the continuum so it was used for the line analysis. The expected position of the [Ne II] line is overplotted with a black dash-dotted line, we note that the line is shifted. The right panel shows the difference between the line flux and the continuum flux in order to show the real strength of the line.
Current usage metrics show cumulative count of Article Views (full-text article views including HTML views, PDF and ePub downloads, according to the available data) and Abstracts Views on Vision4Press platform.
Data correspond to usage on the plateform after 2015. The current usage metrics is available 48-96 hours after online publication and is updated daily on week days.
Initial download of the metrics may take a while.