Fig. 1
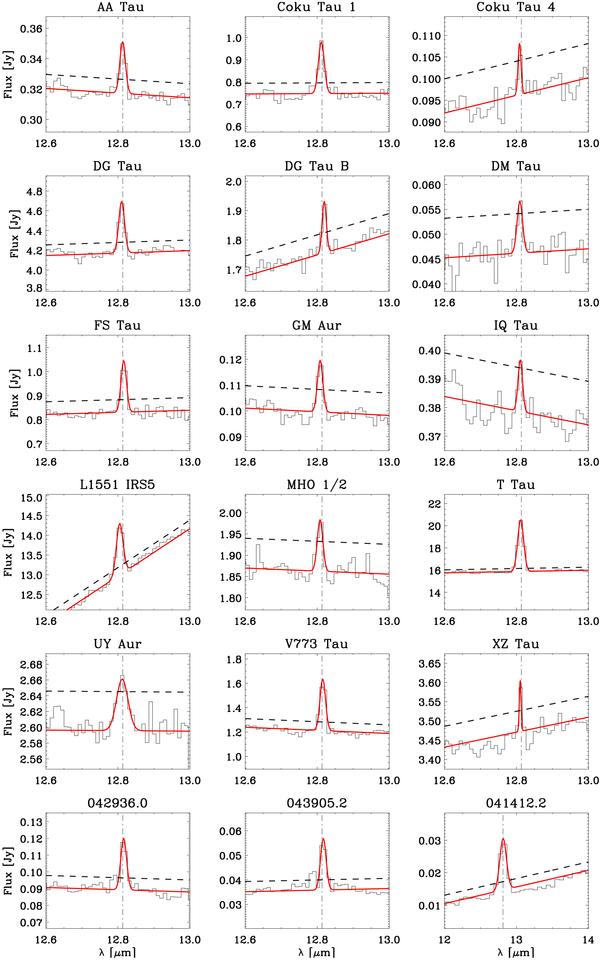
Detections of [Ne II] at 12.81 μm. The spectra are plotted as solid histogram, the lines were fitted using a gaussian profile plus a polynomial component for the continuum, the fit is plotted using a solid line. The 3σ detection threshold is plotted as a dashed line. The name of each star is labeled in the top of each plot. We recall that the spectrum of SST 041412.2+280837 was obtained using the low resolution modules (SL and LL).
Current usage metrics show cumulative count of Article Views (full-text article views including HTML views, PDF and ePub downloads, according to the available data) and Abstracts Views on Vision4Press platform.
Data correspond to usage on the plateform after 2015. The current usage metrics is available 48-96 hours after online publication and is updated daily on week days.
Initial download of the metrics may take a while.