Fig. 5
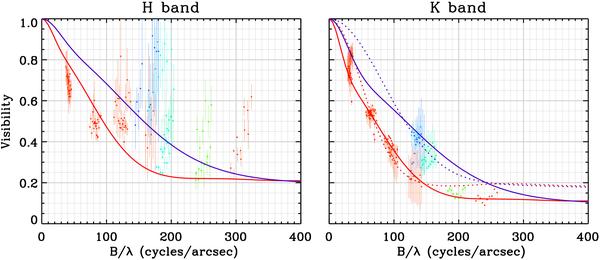
Model fitting of the VLTI/AMBER data, using the parameters obtained by LITpro: right panel for the K-band assuming both scenarios as described in the text for Model 1 (dotted lines) and 2 (solid lines), and left panel for the H-band assuming a scenario like Model 2. The different colors follow the same description as in Fig. 3, representing the orientation of the baselines.
Current usage metrics show cumulative count of Article Views (full-text article views including HTML views, PDF and ePub downloads, according to the available data) and Abstracts Views on Vision4Press platform.
Data correspond to usage on the plateform after 2015. The current usage metrics is available 48-96 hours after online publication and is updated daily on week days.
Initial download of the metrics may take a while.