Fig. 4
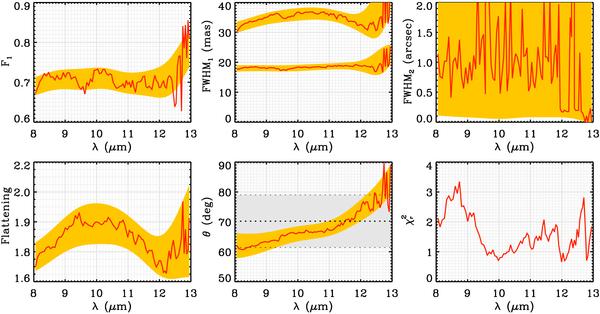
Best-fit model parameters and  for the 2-Gaussian model considering only the VLTI/MIDI data. All the parameters are plotted as a function of the wavelength: flux ratio of the compact component (top left); FWHM of the major and minor axes of the compact component (top center); FWHM of the major-axis of the large component (top right); flattening (bottom left); orientation of the major-axis (bottom center); and
  (bottom right).
Current usage metrics show cumulative count of Article Views (full-text article views including HTML views, PDF and ePub downloads, according to the available data) and Abstracts Views on Vision4Press platform.
Data correspond to usage on the plateform after 2015. The current usage metrics is available 48-96 hours after online publication and is updated daily on week days.
Initial download of the metrics may take a while.