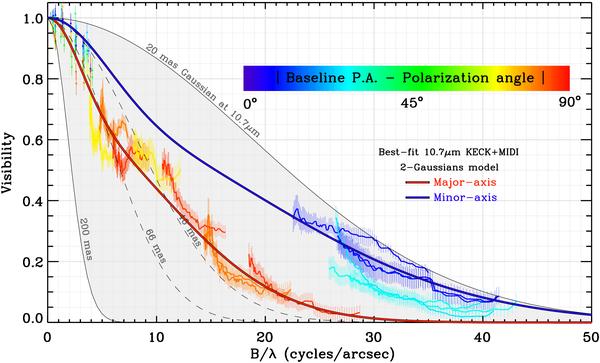
Fig. 3

VLTI/MIDI N-band spectrally resolved visibilities plotted as a function of the spatial frequency (B/λ) for the 14 baselines. Colors indicate the baselines position angle with respect to the polarization measurement by Yudin & Evans (1998). The color scale (i.e., blue, cyan, green, yellow, orange, and red) goes from blue for baselines parallel to the polarization angle to red for the perpendicular ones. The dots with error bars indicate the 10.7 μm Keck measurements. The thin solid and dashed lines represent the visibilities from Gaussian disks with different FWHM. The thick red solid line represents the model fitting aligned to the PA of the major axes of the 2-Gaussian distributions and the blue one to the PA of the minor axes.
Current usage metrics show cumulative count of Article Views (full-text article views including HTML views, PDF and ePub downloads, according to the available data) and Abstracts Views on Vision4Press platform.
Data correspond to usage on the plateform after 2015. The current usage metrics is available 48-96 hours after online publication and is updated daily on week days.
Initial download of the metrics may take a while.


