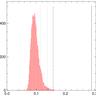
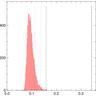
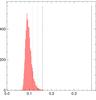
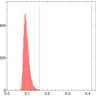
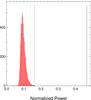
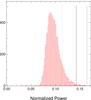
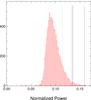
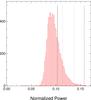
Fig. 3
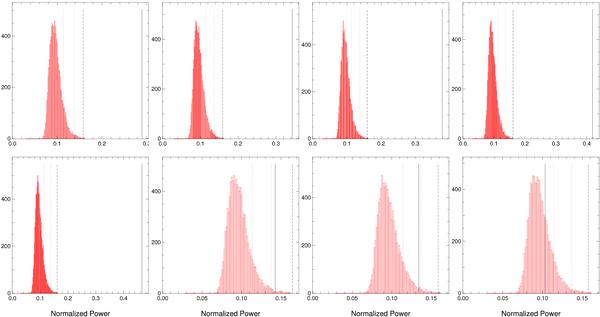
Peak-power distributions of the random permutations of the residuals to the successive multi-Keplerian models. The peak power of the actual data is shown as a full vertical line, while 10%, 1% and 0.1% thresholds are shown as dashed lines. From left to right and top to bottom, the peak power corresponds to periods of 50 d, 5.8 d, 122 d, 2200 d, 16 d, 600 d and 1.18 d. The first five signals have extremely high significance, while the 6th and 7th signals have 0.6% and 1.4% FAP, respectively. Nothing significant remains after subtracting the seven-Keplerian model.
Current usage metrics show cumulative count of Article Views (full-text article views including HTML views, PDF and ePub downloads, according to the available data) and Abstracts Views on Vision4Press platform.
Data correspond to usage on the plateform after 2015. The current usage metrics is available 48-96 hours after online publication and is updated daily on week days.
Initial download of the metrics may take a while.