Free Access
Fig. 7
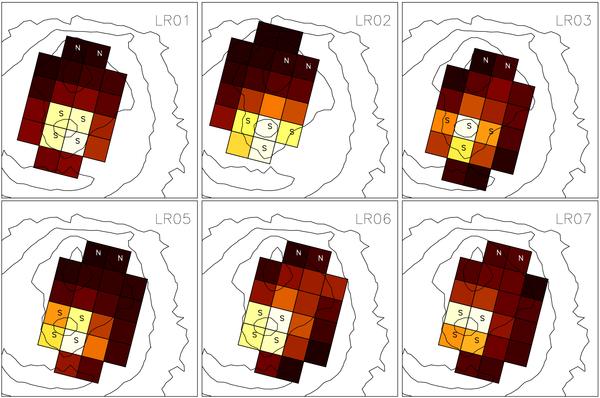
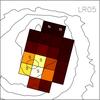
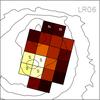
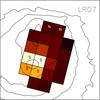
Selected spaxels averaged to form the CSPN (S) and outer nebula (N) spectra in each grating setting. Lighter colours indicate higher average intensity per spaxel reflecting the central star position. Contours are chosen to show the main nebula features (Fig. 6).
This figure is made of several images, please see below:
Current usage metrics show cumulative count of Article Views (full-text article views including HTML views, PDF and ePub downloads, according to the available data) and Abstracts Views on Vision4Press platform.
Data correspond to usage on the plateform after 2015. The current usage metrics is available 48-96 hours after online publication and is updated daily on week days.
Initial download of the metrics may take a while.