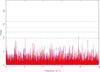
Fig. 5
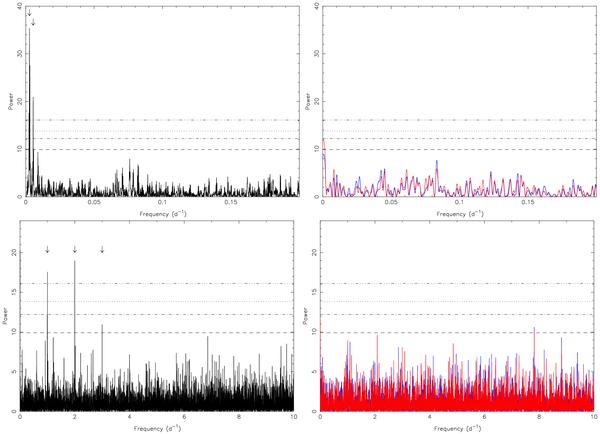
Same as Fig. 3 but for the detrended OGLE-II and OGLE-III data at light maximum (left column) and the MACHO V (blue) and R (red) data during light minimum (right column). All marked peaks in the OGLE data are sampling aliases of 6 or 12 months, and 1, 2 or 3 days. These peaks are absent from the less frequently sampled MACHO data.
Current usage metrics show cumulative count of Article Views (full-text article views including HTML views, PDF and ePub downloads, according to the available data) and Abstracts Views on Vision4Press platform.
Data correspond to usage on the plateform after 2015. The current usage metrics is available 48-96 hours after online publication and is updated daily on week days.
Initial download of the metrics may take a while.