Fig. 2
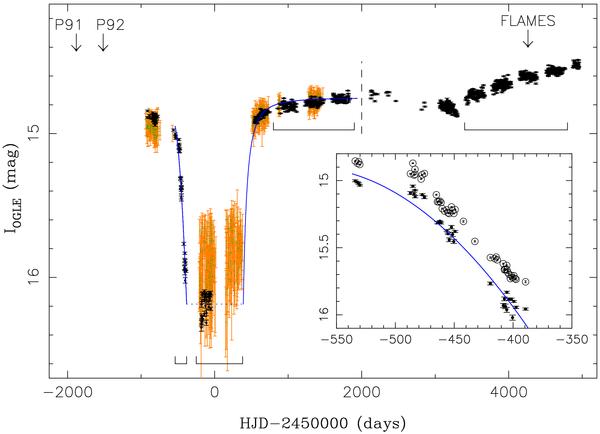
OGLE I-band (black points) and MACHO Cousins R (green points, shifted − 0.9 mag) lightcurves of M 2-29. The blue lines are GS92 RCB star model fits. The inset shows the ingress in the old (circles) and final (points) OGLE-I lightcurves. Spectroscopic observations are arrowed and ranges analysed for periodic variability marked. The dashed vertical line demarcates OGLE-II from OGLE-III data.
Current usage metrics show cumulative count of Article Views (full-text article views including HTML views, PDF and ePub downloads, according to the available data) and Abstracts Views on Vision4Press platform.
Data correspond to usage on the plateform after 2015. The current usage metrics is available 48-96 hours after online publication and is updated daily on week days.
Initial download of the metrics may take a while.