Free Access
Fig. 12
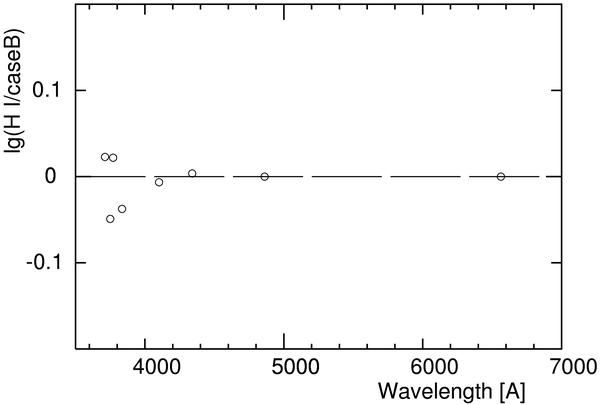
Residual H I emission line intensities for Case B conditions and c = 0.95. The slightly larger scatter at λ < 4000 Å is consistent with the lower intensities of these lines and the difficulty of instrumental and flux calibration at these wavelengths.
Current usage metrics show cumulative count of Article Views (full-text article views including HTML views, PDF and ePub downloads, according to the available data) and Abstracts Views on Vision4Press platform.
Data correspond to usage on the plateform after 2015. The current usage metrics is available 48-96 hours after online publication and is updated daily on week days.
Initial download of the metrics may take a while.