Fig. 9
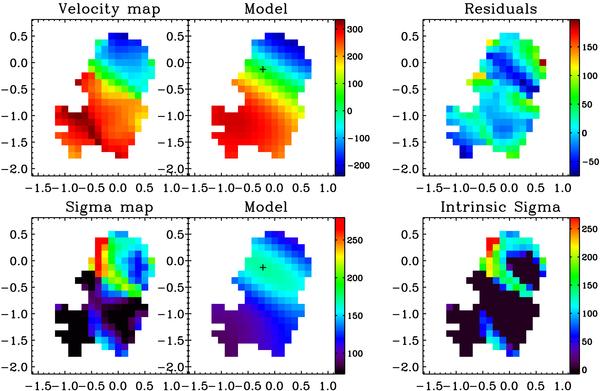
Fit results for the object SSA22A-M38. Respectively on top panels from the left: data, model and residuals map. On bottom panels from the left: data, model and “intrinsic sigma” map. The plus sign on the middle panels represents the position of the model dynamical center. The X − Y coordinates are in arcsec referred to an arbitrary object center position. The north direction is the positive y axis. The vertical color bars are in km s-1.
Current usage metrics show cumulative count of Article Views (full-text article views including HTML views, PDF and ePub downloads, according to the available data) and Abstracts Views on Vision4Press platform.
Data correspond to usage on the plateform after 2015. The current usage metrics is available 48-96 hours after online publication and is updated daily on week days.
Initial download of the metrics may take a while.