Fig. 23
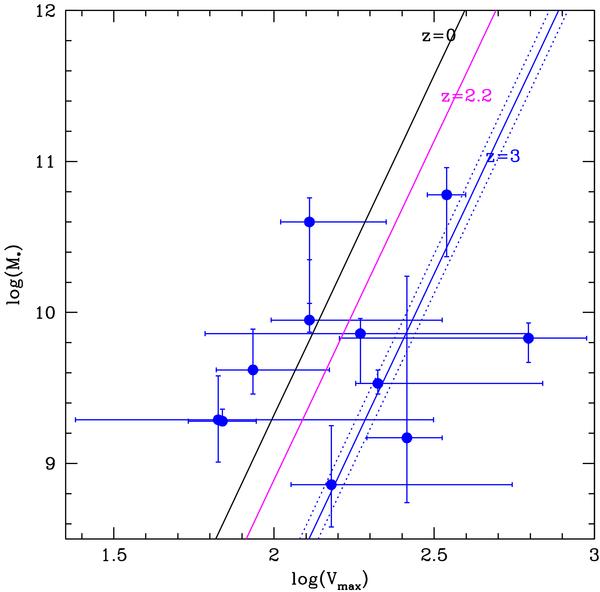
The Tully-Fisher relation at z ~ 3 reconstructed by using the dynamical and stellar masses of the rotating galaxies found in our sample. The solid black line represents the local relation, the magenta line represents the z ~ 2 relation (Cresci et al. 2009) and blue solid line represents the fit to our data (z ~ 3) by keeping the same slope as for the local and z ~ 2 cases. The dotted blue lines represents the formal 1σ uncertainty on the zero point of our fitted relation.
Current usage metrics show cumulative count of Article Views (full-text article views including HTML views, PDF and ePub downloads, according to the available data) and Abstracts Views on Vision4Press platform.
Data correspond to usage on the plateform after 2015. The current usage metrics is available 48-96 hours after online publication and is updated daily on week days.
Initial download of the metrics may take a while.