Fig. 20
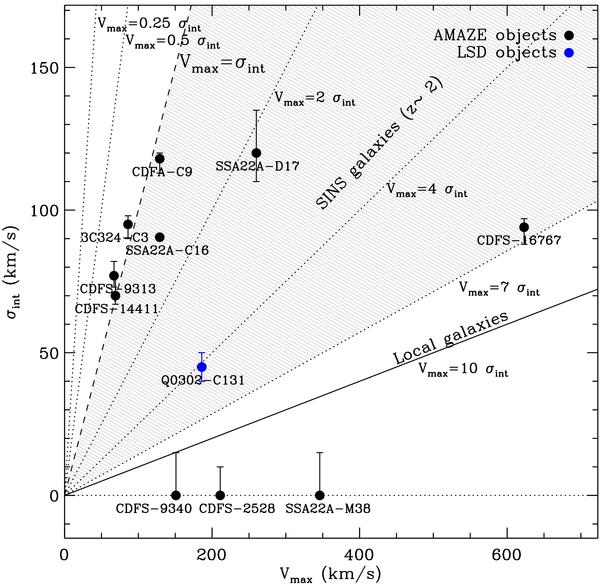
Maximum rotational velocity Vmax versus intrinsic velocity dispersion σint. Objects from the AMAZE and LSD samples are marked with black and blue symbols, respectively. The σint value is obtained fitting the observed velocity dispersion map and error bars represent 1σ uncertainties. Overplotted the Vmax = σint locus (dashed line), the Vmax = k σint loci (dotted lines), the mean value of Vmax/σ for the local galaxies (continuous line) and the Vmax/σ interval for the SINS sample at z ~ 2 (Förster Schreiber et al. 2009) (gray region).
Current usage metrics show cumulative count of Article Views (full-text article views including HTML views, PDF and ePub downloads, according to the available data) and Abstracts Views on Vision4Press platform.
Data correspond to usage on the plateform after 2015. The current usage metrics is available 48-96 hours after online publication and is updated daily on week days.
Initial download of the metrics may take a while.