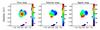
Fig. 1
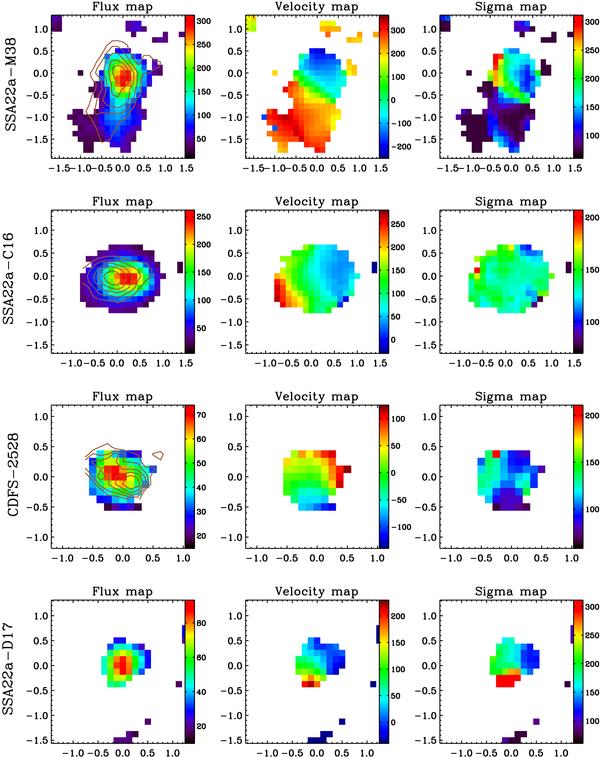
Kinematical maps for objects SSA22A-M38, SSA22A-C16, CDFS-2528 and SSA22A-D17 (from the top respectively). Respectively, from the left: flux, velocity and sigma map. the X − Y coordinates are in arcseconds referred to an arbitrary object center position. The north direction is the positive Y axis. The vertical color bars are in arbitrary units for the flux map and in km s-1 for the velocity and sigma maps. Overplotted on the flux map the continuum flux distribution (brown isophotes) for the object whenever we detect a continuum flux component with sufficient S/N.
Current usage metrics show cumulative count of Article Views (full-text article views including HTML views, PDF and ePub downloads, according to the available data) and Abstracts Views on Vision4Press platform.
Data correspond to usage on the plateform after 2015. The current usage metrics is available 48-96 hours after online publication and is updated daily on week days.
Initial download of the metrics may take a while.