Free Access
Fig. 10
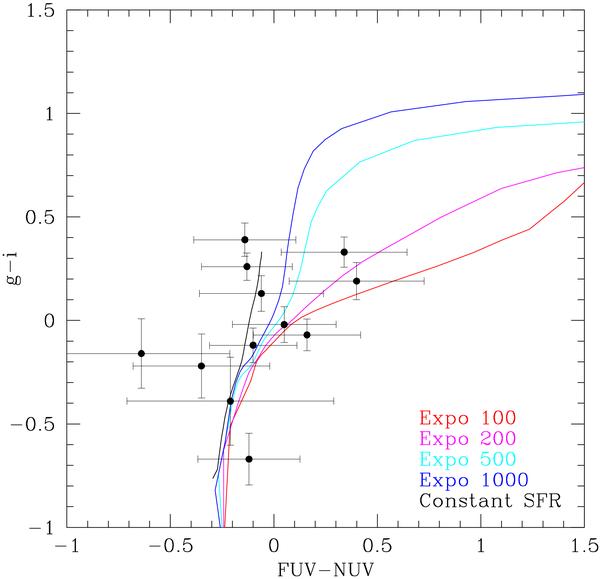
Color–color diagram of FUV − NUV and g − i for the blobs in the wake of VCC 1217. The solid lines are the predictions of some star formation history models: constant star formation rate and exponential star formation rate with τ 100, 200, 500 and 1000 Myr, color coded as in the legend.
Current usage metrics show cumulative count of Article Views (full-text article views including HTML views, PDF and ePub downloads, according to the available data) and Abstracts Views on Vision4Press platform.
Data correspond to usage on the plateform after 2015. The current usage metrics is available 48-96 hours after online publication and is updated daily on week days.
Initial download of the metrics may take a while.