Fig. 16
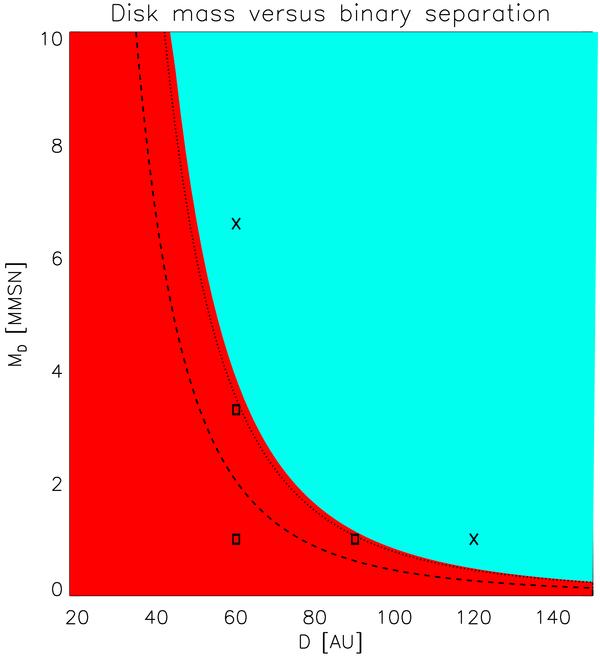
Plot of the parameter regime explored in the simulations. The diagram shows disc mass against binary separation, with the red area denoting the region where the Kozai mechanism should operate, and the cyan area showing the region where it should not for a planetesimal located at 11 AU. The symbols denote the outcome of the simulations, where a cross implies that the Kozai effect was switched off, and an open square indicates that the Kozai mechanism operates. The dashed and dotted line represents the same boundary for a body at ai = 6 AU and ai = 15 AU respectively.
Current usage metrics show cumulative count of Article Views (full-text article views including HTML views, PDF and ePub downloads, according to the available data) and Abstracts Views on Vision4Press platform.
Data correspond to usage on the plateform after 2015. The current usage metrics is available 48-96 hours after online publication and is updated daily on week days.
Initial download of the metrics may take a while.