Free Access
Fig. 6
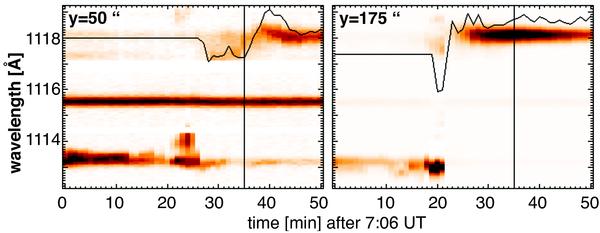
Spectral evolution at positions of the Doppler-shift oscillations. The spectra were averaged over 10″ and displayed with the FeXIX window at the top, CaX in the middle and Si iii at the bottom. A black vertical line was drawn at the start of the measured FeXIX oscillations.
Current usage metrics show cumulative count of Article Views (full-text article views including HTML views, PDF and ePub downloads, according to the available data) and Abstracts Views on Vision4Press platform.
Data correspond to usage on the plateform after 2015. The current usage metrics is available 48-96 hours after online publication and is updated daily on week days.
Initial download of the metrics may take a while.