Fig. 3
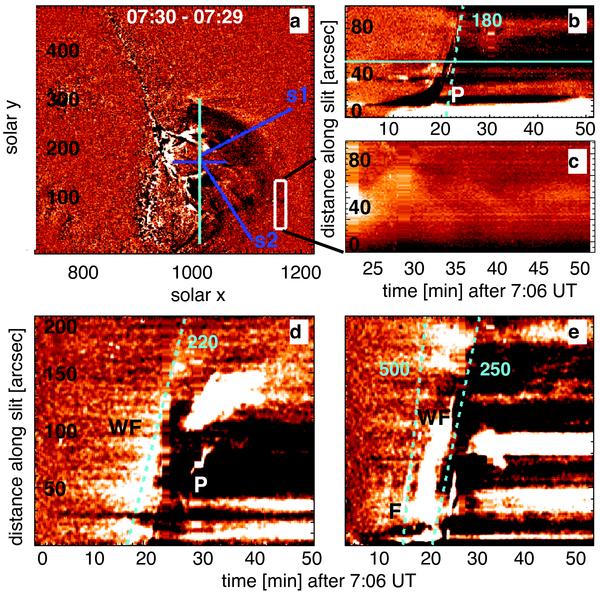
a) TRACE 195 Å running-difference context image with the synthetic slits (blue solid lines and the white rectangle). The position of the SUMER slit is represented with the vertical cyan line. b)–e) TRACE 195 Å time-distance plots along the synthetic slits. The prominence (P), wide front (WF) and flows (F) are marked. Pre-event background intensities were subtracted from each time series. The apparent plane-of-sky velocities along the slits are given alongside the cyan dashed lines running along the erupting filament b) and along the fronts and flows d) and e). b) Intensity variation along the horizontal slit constructed at y = 170″. c) Time evolution of TRACE intensity, averaged over the solar x width of the white rectangle in a). d), e) Intensity variation along the slits labelled s1 and s2, respectively.
Current usage metrics show cumulative count of Article Views (full-text article views including HTML views, PDF and ePub downloads, according to the available data) and Abstracts Views on Vision4Press platform.
Data correspond to usage on the plateform after 2015. The current usage metrics is available 48-96 hours after online publication and is updated daily on week days.
Initial download of the metrics may take a while.