Fig. 2
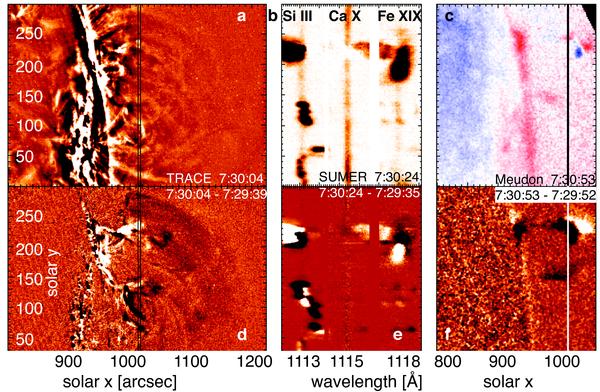
Flare evolution: a) TRACE contrast-enhanced intensity b) SUMER spectral windows centered at 1113 Å, 557 Å, and 1118 Å shown in reverse color c) Meudon heliograph Hα Dopplergrams d) TRACE running difference e) SUMER running difference f) Hα running difference. Two vertical lines indicate the position of the SUMER slit in the TRACE and Hα images.
Current usage metrics show cumulative count of Article Views (full-text article views including HTML views, PDF and ePub downloads, according to the available data) and Abstracts Views on Vision4Press platform.
Data correspond to usage on the plateform after 2015. The current usage metrics is available 48-96 hours after online publication and is updated daily on week days.
Initial download of the metrics may take a while.