Fig. 1
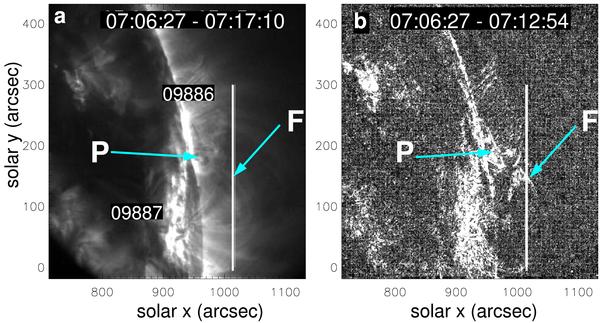
a) Average TRACE 195 Å image of AR09886 and surrounding region: a) average intensity between 07:06 and 07:17 UT showing the prominence (P) that later erupted; b) power map for frequencies of less than 5 mHz (periods greater than 3.3 min). Flows (F) are detected in the corona crossing the SUMER slit, which is indicated with a white vertical line.
Current usage metrics show cumulative count of Article Views (full-text article views including HTML views, PDF and ePub downloads, according to the available data) and Abstracts Views on Vision4Press platform.
Data correspond to usage on the plateform after 2015. The current usage metrics is available 48-96 hours after online publication and is updated daily on week days.
Initial download of the metrics may take a while.