Free Access
Fig. 3
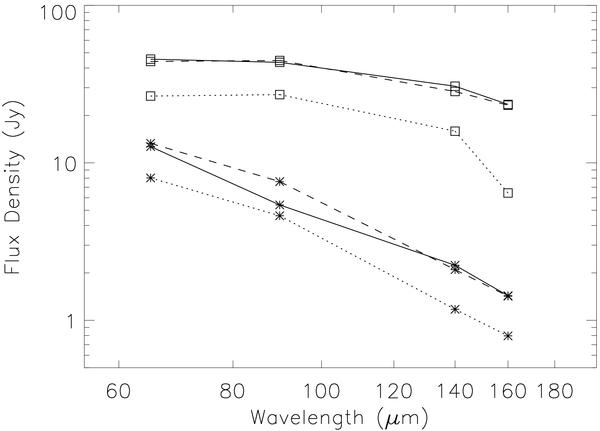
Far-infrared spectral engergy distributions of the central point-like source (asterisks) and the extended dust shell (squares). Dotted, dashed, and solid lines indicate raw, intensity corrected, and intensity and color corrected data, respectively (see text).
Current usage metrics show cumulative count of Article Views (full-text article views including HTML views, PDF and ePub downloads, according to the available data) and Abstracts Views on Vision4Press platform.
Data correspond to usage on the plateform after 2015. The current usage metrics is available 48-96 hours after online publication and is updated daily on week days.
Initial download of the metrics may take a while.