Fig. 2
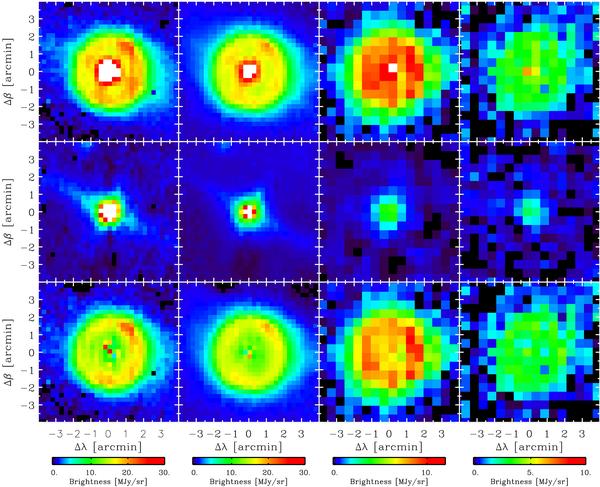
Decomposition of (top row) the far-infrared image of U Hya at each FIS band shown in Fig. 1 into (middle row) a compact source and (bottom row) an extended shell. Each panel measures 8′ × 8′. From left to right the columns shown are N60, WIDE-S, WIDE-L, and N160 images. Each color bar at the bottom is common to the column and shows the brightness scale before color and extra intensity corrections (see text) in units of MJy sr-1. Ecliptic north is up and ecliptic east is to the left. Equatorial north and east are tilted by  as in Fig. 1.
Current usage metrics show cumulative count of Article Views (full-text article views including HTML views, PDF and ePub downloads, according to the available data) and Abstracts Views on Vision4Press platform.
Data correspond to usage on the plateform after 2015. The current usage metrics is available 48-96 hours after online publication and is updated daily on week days.
Initial download of the metrics may take a while.