Fig. 9
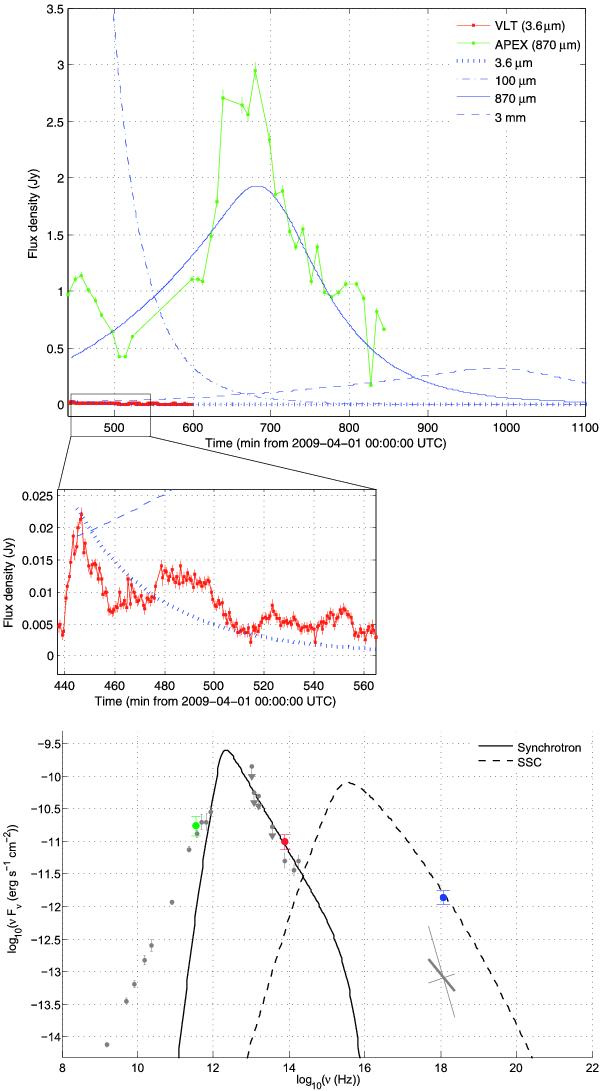
(Top panel) APEX and VLT light curves plotted on the same scale. Theoretical predictions of model I for several wavelengths are overplotted in blue. (Middle panel) Magnified view of the VLT data. (Bottom panel) The synchrotron and SSC curves give the initial SED of the plasmoid in model I. They fit the simulaneous NIR and X-ray data (in red and blue respectively) of Flare A. The non-simultaneous sub-mm data of Flare A′ are also indicated in green for information. The references of the quiescence data in light gray are given in Trap et al. (2010).
Current usage metrics show cumulative count of Article Views (full-text article views including HTML views, PDF and ePub downloads, according to the available data) and Abstracts Views on Vision4Press platform.
Data correspond to usage on the plateform after 2015. The current usage metrics is available 48-96 hours after online publication and is updated daily on week days.
Initial download of the metrics may take a while.