Fig. 8
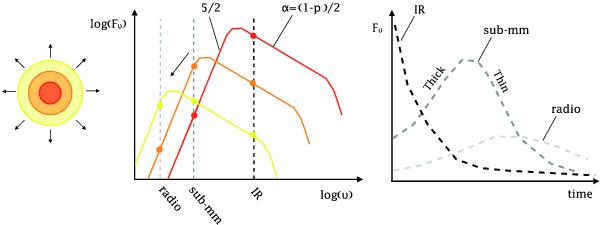
Sketches of the van der Laan (1966) model. As the plasmoid expands (left panel), its initial self-absorbed synchrotron spectrum is shifted toward lower frequencies (middle panel). If the source is observed at optically thin frequencies from the beginning, then it remains optically thin and the flux keeps decreasing as time moves on (right panel, NIR curve). Alternatively, if the source is initially optically thick, then the flux rises until the source turns transparent and subsequently declines in the thin regime (right panel, sub-mm and radio curves).
Current usage metrics show cumulative count of Article Views (full-text article views including HTML views, PDF and ePub downloads, according to the available data) and Abstracts Views on Vision4Press platform.
Data correspond to usage on the plateform after 2015. The current usage metrics is available 48-96 hours after online publication and is updated daily on week days.
Initial download of the metrics may take a while.