Free Access
Fig. 14
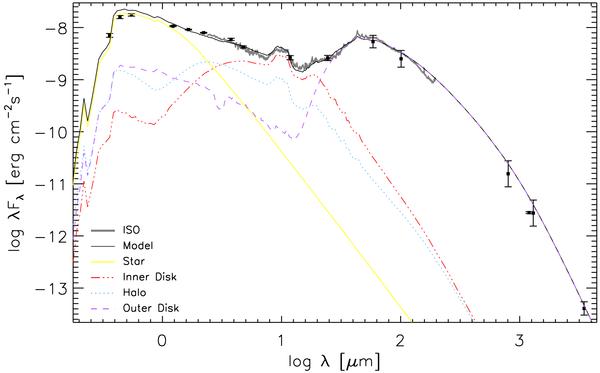
Model fit (black) to the literature photometry (squares with error bars) and ISO spectrum (gray). The different flux components, indicated in the bottom left, represent the photons whose last contact was with that particular model component.
Current usage metrics show cumulative count of Article Views (full-text article views including HTML views, PDF and ePub downloads, according to the available data) and Abstracts Views on Vision4Press platform.
Data correspond to usage on the plateform after 2015. The current usage metrics is available 48-96 hours after online publication and is updated daily on week days.
Initial download of the metrics may take a while.