Fig. 5
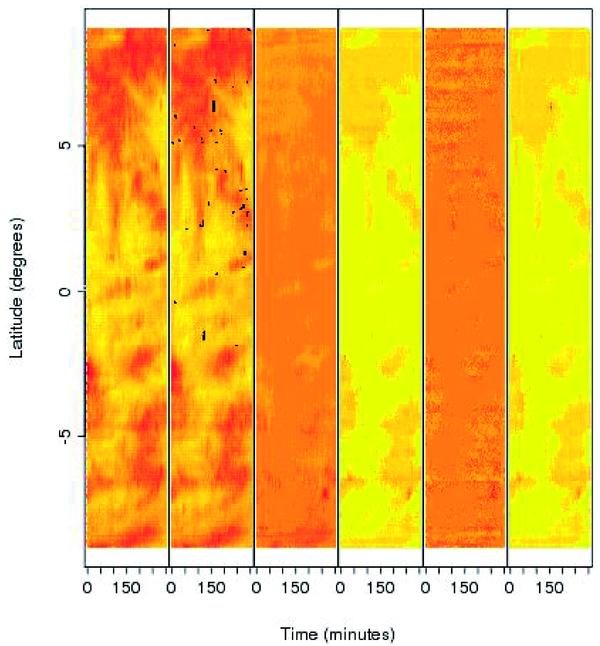
Time-latitude diagram for the first series of observations. In the leftmost panel the total line radiance is shown in a logarithmic colour scale from yellow (lowest) to red (highest values). The next plot to the right shows the same diagram with the position of the quiet Sun C iv outliers superimposed. Finally, form left to right, the same time-latitude diagram with the colour code representing the first, second, third, and fourth order moments in a linear scale.
Current usage metrics show cumulative count of Article Views (full-text article views including HTML views, PDF and ePub downloads, according to the available data) and Abstracts Views on Vision4Press platform.
Data correspond to usage on the plateform after 2015. The current usage metrics is available 48-96 hours after online publication and is updated daily on week days.
Initial download of the metrics may take a while.