Fig. 4
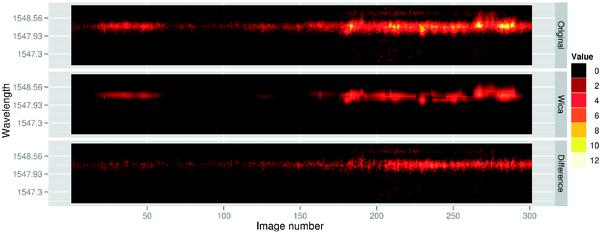
Example of the application of the wICA algorithm to a slice of the data cube showing the time evolution of the C iv line for a fixed position along the slit. From top to bottom we show the original image, the result of the wICA algorithm, and the residual image. The images show time in minutes along the x axis, and wavelength in Angstroms along the y axis.
Current usage metrics show cumulative count of Article Views (full-text article views including HTML views, PDF and ePub downloads, according to the available data) and Abstracts Views on Vision4Press platform.
Data correspond to usage on the plateform after 2015. The current usage metrics is available 48-96 hours after online publication and is updated daily on week days.
Initial download of the metrics may take a while.