Free Access
Fig. 22
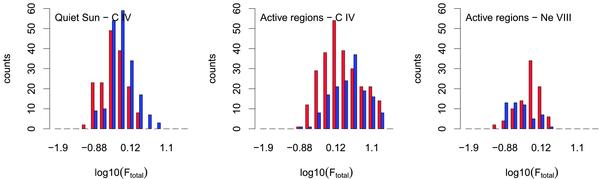
Histograms of the number of explosive events in bins of total line radiance. Similar to Fig. 15, but here for velocity thresholds: red bars correspond to explosive events with maximum velocities in the red wing higher than the corresponding blue maximum velocity, and blue bars to higher maximum velocities in the blue.
Current usage metrics show cumulative count of Article Views (full-text article views including HTML views, PDF and ePub downloads, according to the available data) and Abstracts Views on Vision4Press platform.
Data correspond to usage on the plateform after 2015. The current usage metrics is available 48-96 hours after online publication and is updated daily on week days.
Initial download of the metrics may take a while.