Fig. 17
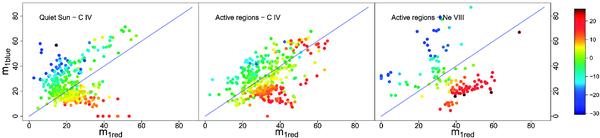
First moments (m1) of the red and blue windows at each side of the rest wavelength (x and y axes respectively). The colour code represents the second order moment of the red wing minus the second order moment of the blue one. Blue correponds to the lowest values of the difference and red corresponds to the highest values. The plots show from left to right the C iv line in the quiet Sun and the C iv and Ne viii lines in the vicinity of the active regions.
Current usage metrics show cumulative count of Article Views (full-text article views including HTML views, PDF and ePub downloads, according to the available data) and Abstracts Views on Vision4Press platform.
Data correspond to usage on the plateform after 2015. The current usage metrics is available 48-96 hours after online publication and is updated daily on week days.
Initial download of the metrics may take a while.