Fig. 13
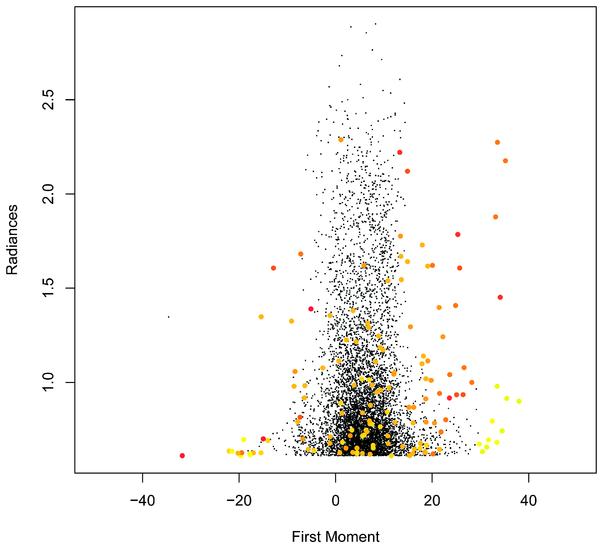
Distribution of first order moments and radiances of the Ne viii line in the proximity of the two active regions NOAA 8998 and NOAA 9004. The x axis represents the first order moment of the line profile in units of km s-1, and the y axis, the Ne viii integrated line radiance in units of W m-2 sr-1. Outliers (explosive events) are represented using a colour code indicative of the second order moments of the line profiles.
Current usage metrics show cumulative count of Article Views (full-text article views including HTML views, PDF and ePub downloads, according to the available data) and Abstracts Views on Vision4Press platform.
Data correspond to usage on the plateform after 2015. The current usage metrics is available 48-96 hours after online publication and is updated daily on week days.
Initial download of the metrics may take a while.