Free Access
Fig. 12
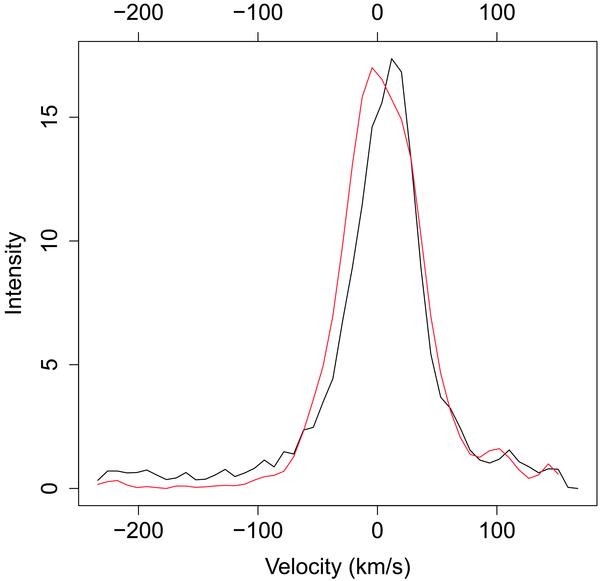
One of the brightest Ne viii line profiles at the tip of the brach of red-shifted line profiles in Fig. 11 corresponding to the quiet Sun regions (black). The red line corresponds to the mean line profile in these quiet Sun rasters. The y axis shows the intensity in the Ne viii line in units of W m-2 sr-1 Å-1.
Current usage metrics show cumulative count of Article Views (full-text article views including HTML views, PDF and ePub downloads, according to the available data) and Abstracts Views on Vision4Press platform.
Data correspond to usage on the plateform after 2015. The current usage metrics is available 48-96 hours after online publication and is updated daily on week days.
Initial download of the metrics may take a while.