Fig. 5
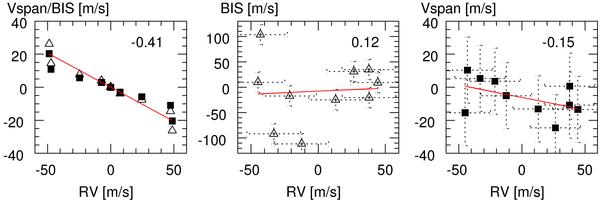
Left: BIS (triangles) and Vspan (squares) as a function of RV for a simulated spot rotating at latitude +50° on a star with an inclination i = 40°. Middle and Right: respectively, BIS (Queloz et al. 2001) and Vspan (this paper) as a function of RV for the same simulated spot with 20 m s-1 additional photonic noise in the CCF. The lines are the least squares fit to the data. The numbers in the right-hand corner is the value of the slope of the fit.
Current usage metrics show cumulative count of Article Views (full-text article views including HTML views, PDF and ePub downloads, according to the available data) and Abstracts Views on Vision4Press platform.
Data correspond to usage on the plateform after 2015. The current usage metrics is available 48-96 hours after online publication and is updated daily on week days.
Initial download of the metrics may take a while.