Fig. 20
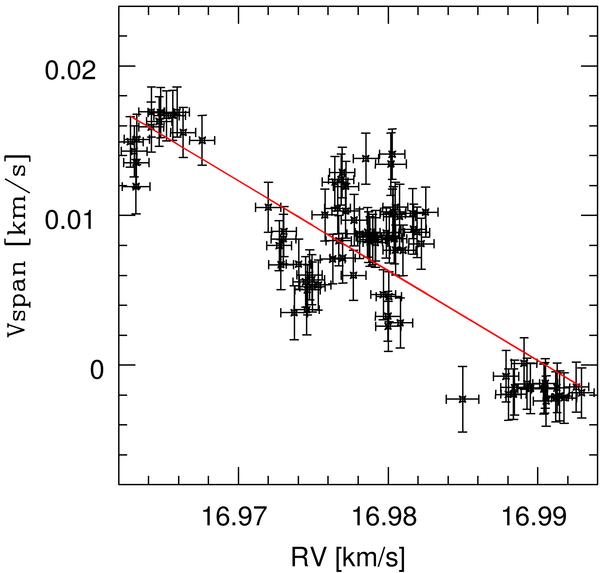
Vspan = RVhigh – RVlow as a function of RV of ι Hor derived from HARPS spectra. The line is the least squares fit. The ranges have the same extents along the x- and y-axes. The error bars are also plotted. One may compare this shape with that of the simulation of two spots separated by 120° in longitude in Fig. 13 (bottom).
Current usage metrics show cumulative count of Article Views (full-text article views including HTML views, PDF and ePub downloads, according to the available data) and Abstracts Views on Vision4Press platform.
Data correspond to usage on the plateform after 2015. The current usage metrics is available 48-96 hours after online publication and is updated daily on week days.
Initial download of the metrics may take a while.