Fig. 15
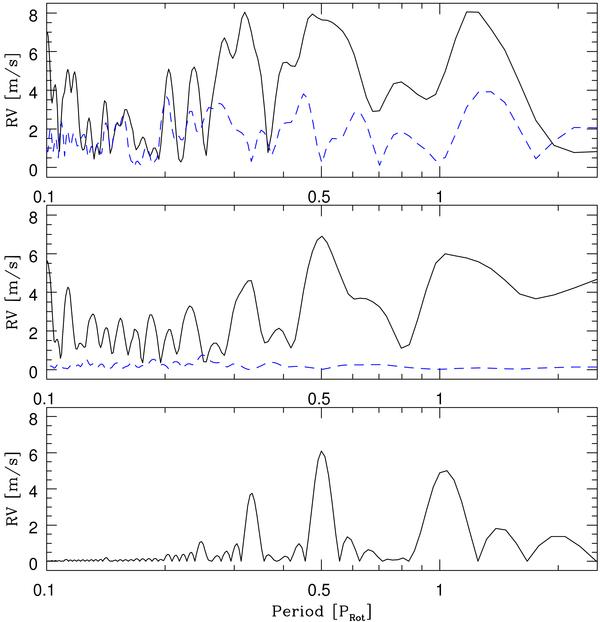
Top: lomb-Scargle periodogram of the residuals from the Keplerian fit of the SOPHIE RV of HD 189733 (black curve). The three peaks at the rotational period and the two first harmonics are detected. The Lomb-Scargle periodogram of the residuals after the simultaneous Keplerian fit and the harmonic filtering of the stellar activity is indicated by a dashed line. Middle: lomb-Scargle periodogram of a simulation of one dark spot on the surface of a star with parameters closest to those of HD 189733 (black curve). The sampling is identical to that of the SOPHIE data for HD 189733. The lomb-Scargle periodogram of the residuals after the simultaneous Keplerian fit and the harmonic filtering of the stellar activity is indicated by a dashed line. Bottom: lomb-Scargle periodogram of the same simulation as in the middle panel with a very good data sampling (one measurement each Prot/1000).
Current usage metrics show cumulative count of Article Views (full-text article views including HTML views, PDF and ePub downloads, according to the available data) and Abstracts Views on Vision4Press platform.
Data correspond to usage on the plateform after 2015. The current usage metrics is available 48-96 hours after online publication and is updated daily on week days.
Initial download of the metrics may take a while.